Research
Crypto hacks surged weeks after AI coding agents arrived
In March, five weeks after OpenAI and Anthropic released coding agents that can find and exploit software flaws on their own, hacks on crypto software surged. This year, hackers have exploited flaws in crypto code 2.5 times as often as they did on average from 2022 to 2025, and those flaws account for 63% of reported losses, up from 20% in 2025, when most of the money was stolen by taking over keys and accounts.
Crypto thieves mostly get in one of two ways. Some take over the keys or accounts that control funds, such as an exchange’s hot wallet or a phished employee. Others exploit bugs in smart contracts, the public programs that run lending markets, exchanges and bridges between blockchains in decentralized finance (DeFi). Which one is rising shows whether the risk sits in a company’s operations or in its code. Our Village monitor tracks every incident in DefiLlama’s hack tracker, a widely used public list of crypto hacks, and compares each year from January 1 to October 19.
Code exploits took off in March
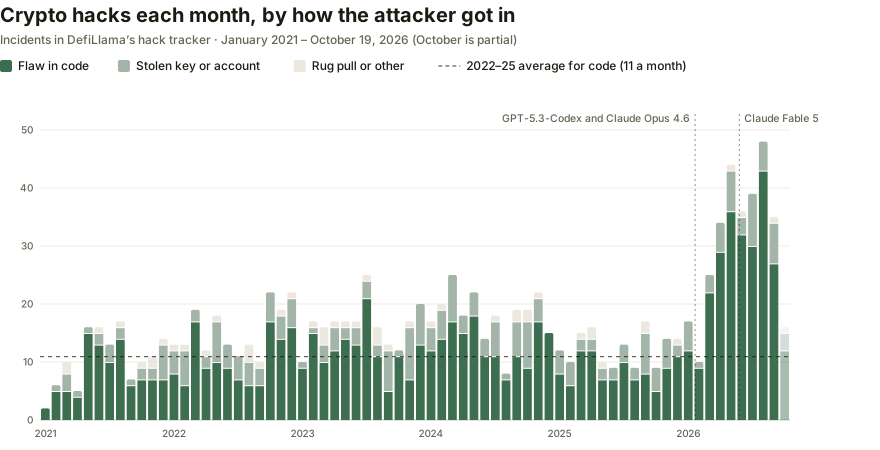
- The break came in the week of March 9. That week brought 8 code exploits, three times the 2022–2025 weekly average, and every month through September ran at two to four times the old monthly pace.
- An independent tracker sees the same jump. SlowMist’s hacked database, compiled separately by a blockchain security firm, shows code exploits at 2.3 times their 2022–2025 pace.
- Key and account takeovers rose far less. They are up 38% on the 2022–2025 average.
The surge followed the arrival of capable coding agents
On February 5, OpenAI released GPT-5.3-Codex and Anthropic released Claude Opus 4.6, models built to work through long programming tasks on their own. Anthropic said Opus 4.6 “finds real vulnerabilities in codebases better than any other model.” Code exploits broke out five weeks later.
- Agents had just become able to drain contracts. On February 18, OpenAI and the crypto investor Paradigm released EVMbench, a test built from serious smart-contract bugs. GPT-5.3-Codex exploited over 70% of them; when the project began, top models managed less than 20%.
- Finding these bugs had become cheap. In December, Anthropic’s red team found that AI agents could reproduce 56% of real exploits from after March 2025, beyond what the models saw in training, at an average cost of $1.22 to scan a contract.
- Claude Fable 5 didn’t mark a new break. It arrived on June 9, three months into the surge, and code exploits in June and July ran slightly below May’s level.
- Reported software flaws surged the same month. New entries in the CVE database also began climbing in March, as we found in our study of reported vulnerabilities.
Our data can’t show who found these bugs or how. DefiLlama doesn’t record whether an attacker used AI, and defenders use the same tools to find and fix flaws. But the timing, and the shape of the growth below, fit attackers putting newly capable agents to work.
Losses followed the code
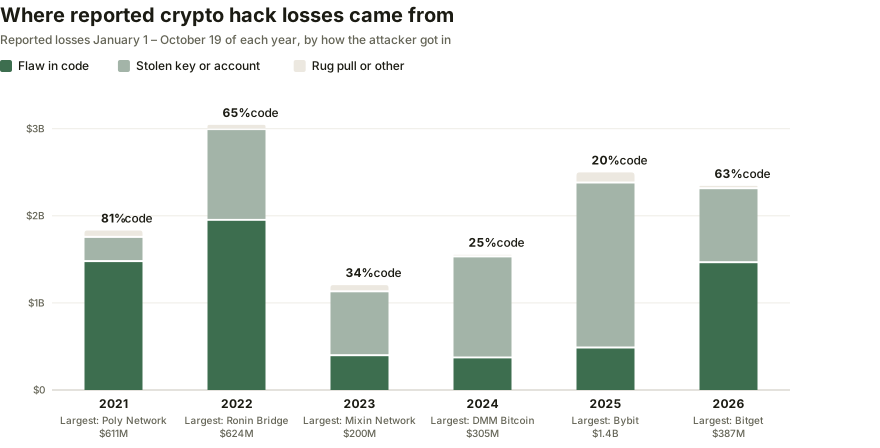
- Losses to code flaws are up 81% on the 2022–2025 average, while losses to stolen keys and accounts are down 30%.
- Total losses barely moved. They are 13% above the 2022–2025 average, so the change is in where the money goes, not how much.
- No single heist defines the year. Last year, Bybit’s $1.4 billion loss was 56% of the total; this year’s largest, a $387 million theft from Bitget’s hot wallet, is 17%.
From 2023 to 2025, most of the money went through compromised keys, signers and infrastructure, at exchanges such as DMM Bitcoin and Bybit. This year looks more like 2021 and 2022, when bugs in bridges and DeFi protocols drove the totals. Four code exploits this year passed $100 million, including bridge flaws at Liquid Network and Kelp.
Most of the growth is in smaller exploits
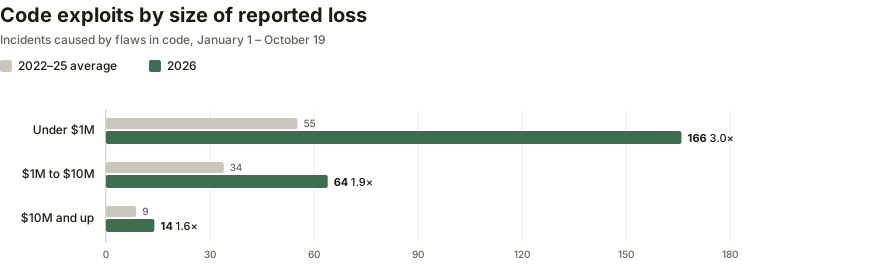
The sharpest rise is among exploits under $1 million, mostly DeFi protocols drained through accounting errors, price-oracle manipulation or missing access checks. That fits automated hunting: when an agent can scan a contract for a few dollars, small protocols become worth attacking. Small incidents are also where a tracker’s coverage is hardest to check, which is why the SlowMist comparison matters. But the rise isn’t confined to small incidents: exploits of $10 million or more are up 60%.
How we built this
This study draws on a Village monitor that our agent built on DefiLlama’s Hacks API. It saves each daily snapshot, keeps every row the tracker lists, and leaves missing amounts blank rather than zero. The figures use the October 20 snapshot, with incidents through October 19, and compare the same January 1–October 19 window in every year. Model release dates come from the labs’ announcements.
DefiLlama classifies each incident; we grouped its classifications into flaws in code (including access-control failures such as an unprotected upgrade function), stolen keys or accounts (including phishing and compromised infrastructure), and rug pulls or market abuse. Losses are the tracker’s reported estimates, valued inconsistently and before any recoveries. A coverage check by our agent against Rekt’s leaderboard and SlowMist found 91% of attacks of $10 million or more since 2020 in DefiLlama’s list, but coverage of smaller incidents can’t be verified the same way, and old incidents can still be added.
Build your own signals on this data. Define what matters to your research and get alerted when it moves.
Proprietary signals from any source. Build pipelines with Village’s agent that gather data from the websites, APIs and documents your research depends on.